KPI Examples for Small Business: 15 Worth Tracking
KPI examples for small business owners: which numbers to track in sales, stock, purchasing, cash and delivery, how to set them up, and how to avoid vanity metrics.
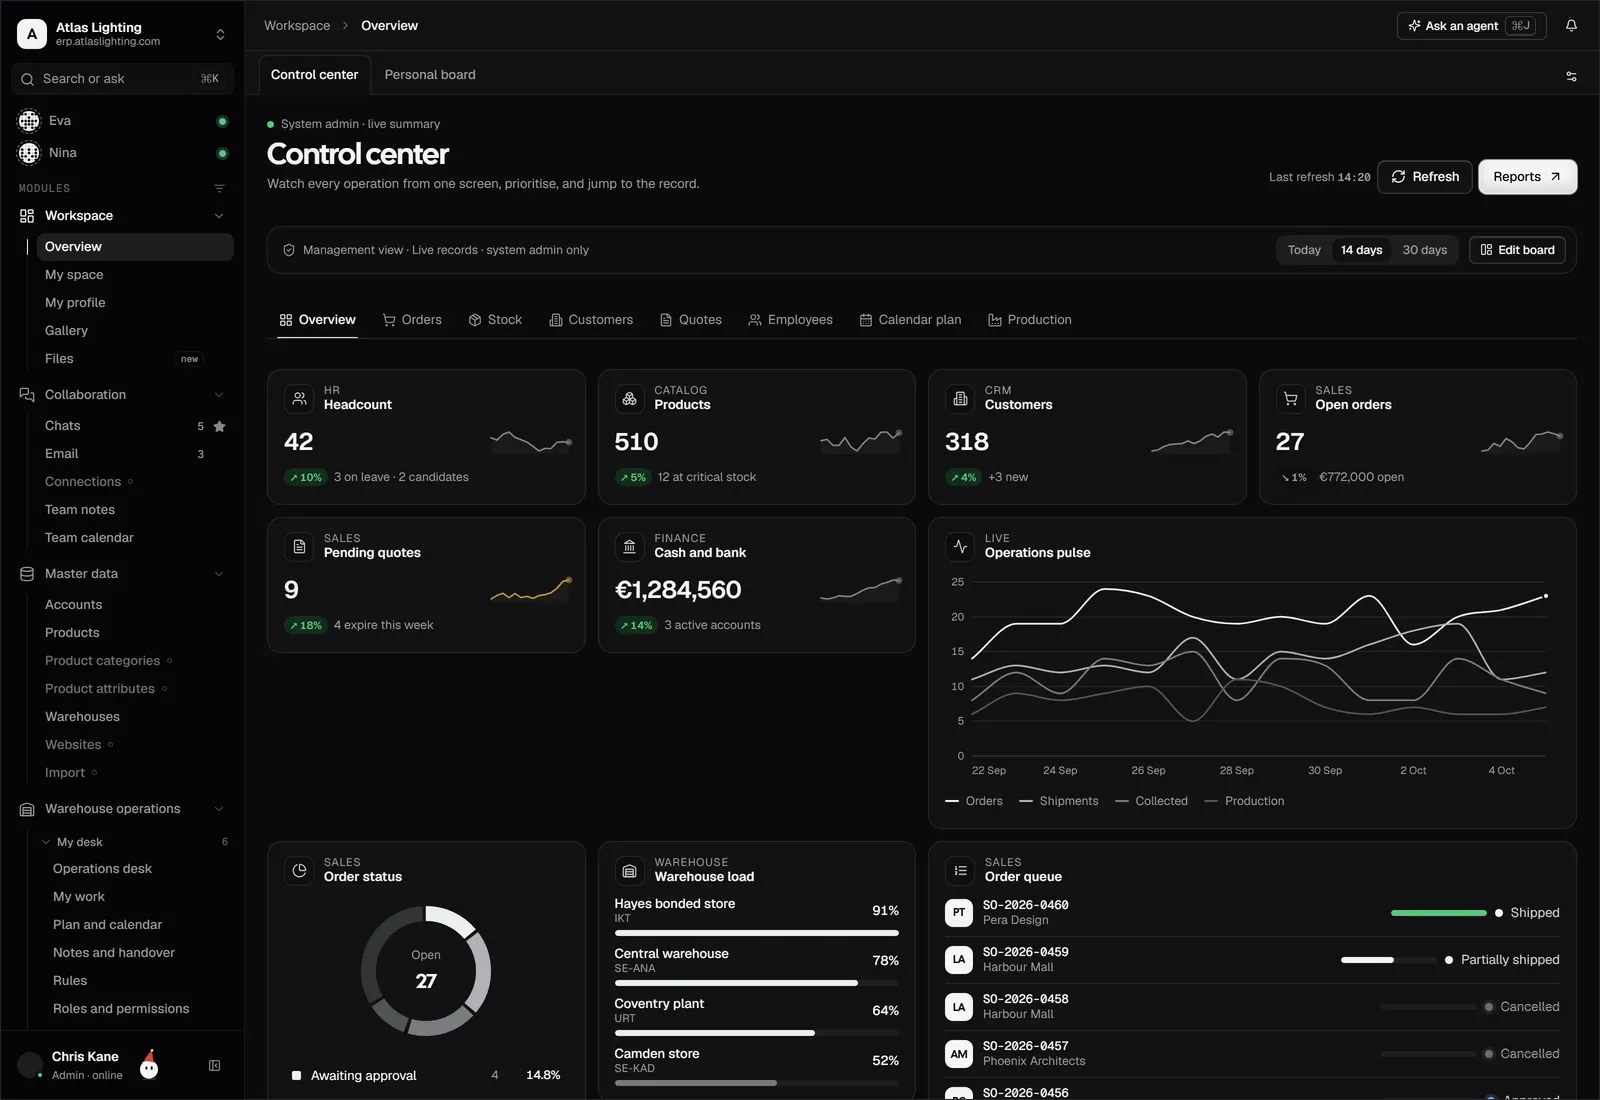
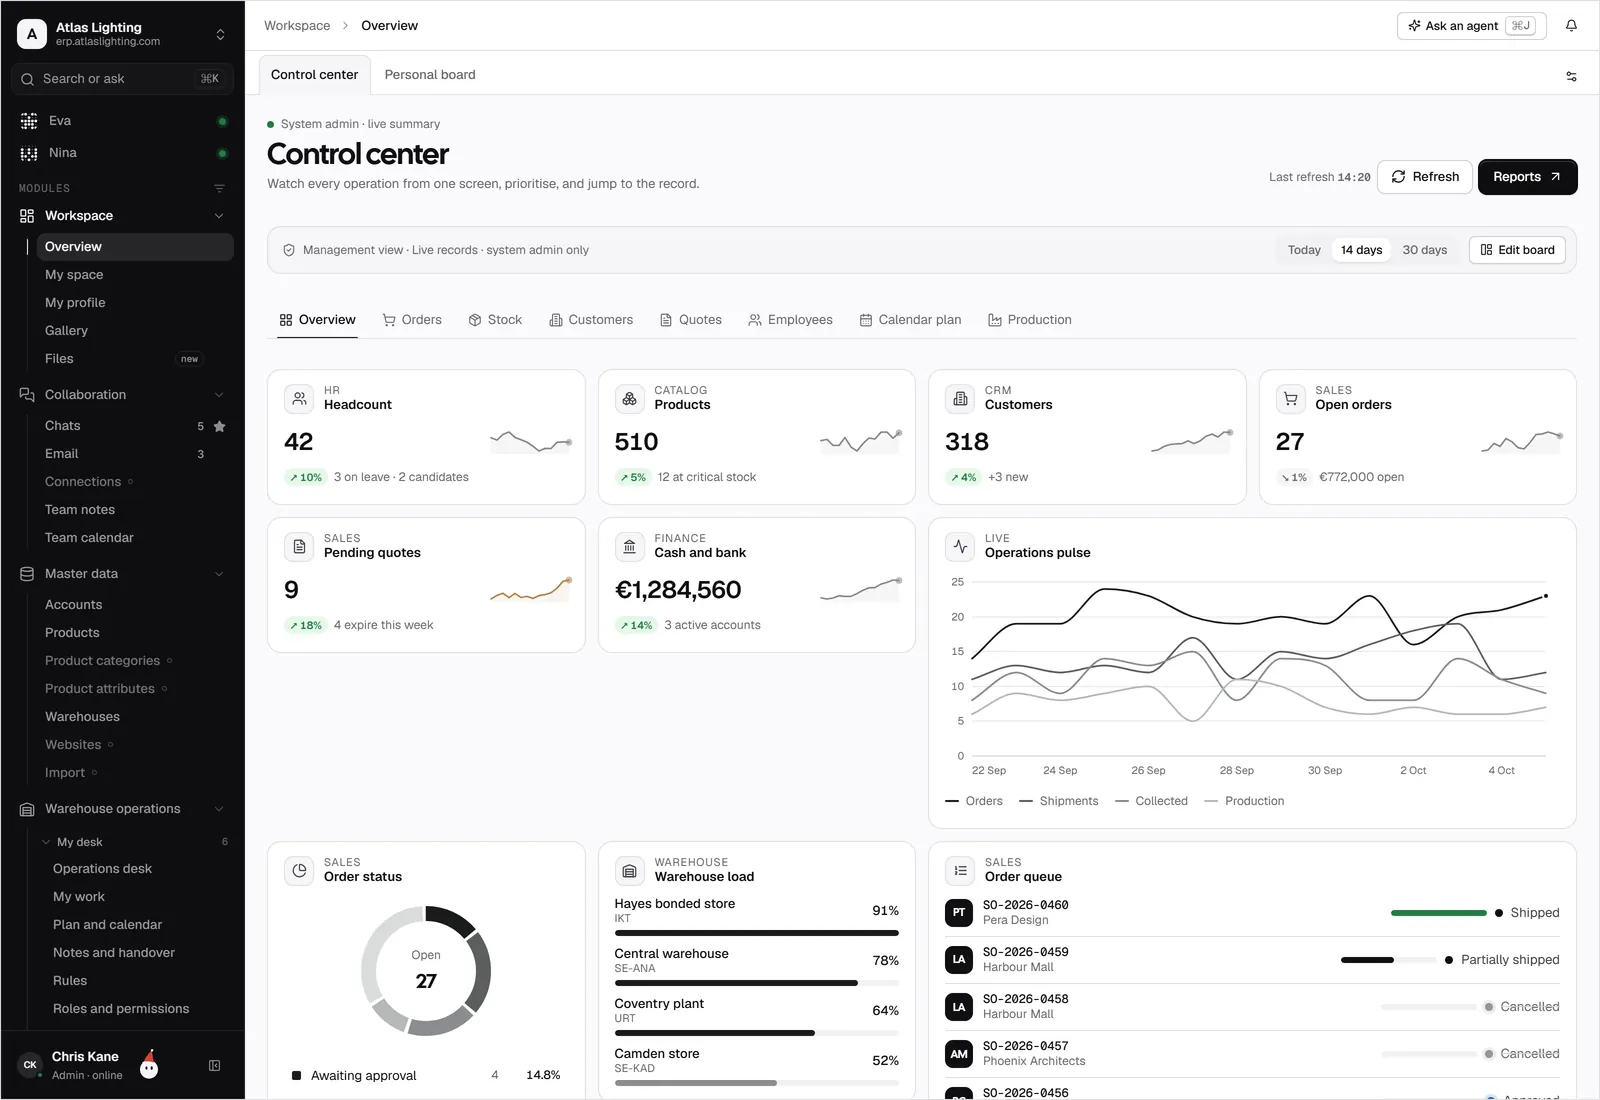
The best KPI examples for a small business are the handful of numbers that tell you, week by week, whether you are selling profitably, delivering on time and staying liquid. For most companies that means around ten to fifteen measures across sales, stock, purchasing, production, delivery and cash, each with a clear owner and a target.
The trap is tracking everything. A dashboard with forty tiles gets ignored; a dashboard with twelve gets read on Monday morning. This guide gives you practical KPI examples by area, shows how to define them so nobody argues about the number, and explains what you need from your systems to keep them current.
What makes a good KPI
A KPI (key performance indicator) is a measure tied to a decision. If nobody would act differently when the number moves, it is trivia, not a KPI. Before you add one, check it against four tests:
- Clear definition. “On-time delivery” must say what counts as on time (promised date, or customer’s requested date?) and what is included (all orders, or only stocked items?).
- One owner. A named person is responsible for moving it.
- A target and a threshold. Green, amber and red mean something only if you have chosen the lines.
- Trusted data. If the figure comes from three spreadsheets that disagree, people will debate the data instead of fixing the problem.
Also separate leading from lagging indicators. Revenue is lagging: it tells you what already happened. Open quotes, pipeline value and stock cover are leading: they hint at what is coming while you can still change it.
KPI examples by area
Sales and customers
- Quote-to-order conversion rate: orders won divided by quotes sent, by period. Falling conversion usually points to pricing or response speed.
- Average order value: revenue divided by number of orders. Useful for spotting discount creep.
- Gross margin by customer or product line: the profit left after direct costs. Revenue growth means little if margin is shrinking.
- Repeat customer rate: the share of customers who ordered again within a set window.
Inventory and purchasing
- Stock turnover or days of stock cover: how long your current stock would last at today’s sales rate.
- Stockout rate: how often a customer order line could not be filled from stock.
- Supplier on-time-in-full (OTIF): the share of purchase order lines delivered on the promised date and in the right quantity.
- Purchase price variance: what you paid compared with the agreed or standard price.
Production and delivery
- Schedule adherence: work orders finished by their planned date.
- First-pass yield: the share of units that pass inspection without rework.
- On-time delivery to customer: orders shipped by the promised date.
- Order cycle time: days from confirmed order to shipment.
Cash and finance
- Days sales outstanding (DSO): the average time it takes to collect payment after invoicing.
- Overdue receivables: the value of invoices past due, split by age band.
- Cash runway or forecast balance: the projected bank balance over the next 13 weeks.
You will not need all fifteen on day one. Pick the three or four that match your biggest current worry. A distributor fighting stockouts starts with stock cover, stockout rate and supplier OTIF. A manufacturer with late deliveries starts with schedule adherence and cycle time.
A simple KPI definition table
Write every KPI down in a single table that anyone can read. Here is a template with one example row:
| KPI | Formula | Source | Owner | Target | Review |
|---|---|---|---|---|---|
| Supplier OTIF | Lines received on time and in full ÷ lines due | Purchase order receipts | Purchasing lead | 95% | Weekly |
Add a row per KPI. The act of filling in “Source” exposes most data problems: if the answer is “I’d have to ask three people”, you have found the first thing to fix.
Setting targets without guessing
Resist copying a number from an article. Start from your own history: look at the last six to twelve months, find the typical level and the best sustained level, and set the target between the two. Then revisit it each quarter. A target that is already met every week is too easy; one that is never met stops motivating anyone.
For tolerances, use a simple traffic-light rule. Green is on target, amber is within a set band (for example, five percentage points), red is beyond it. Agree in advance what happens at red: who looks into it, and by when.
Common mistakes
- Vanity metrics. Website visits or number of quotes sent feel good but rarely drive a decision on their own.
- Averages that hide the problem. An average delivery delay of one day can hide a handful of orders that were three weeks late. Show distribution or the worst offenders as well.
- Changing definitions mid-year. If you redefine a KPI, restate the history or mark the break.
- Too many reviewers, no owner. Everyone watches, nobody acts.
- Manual month-end assembly. If compiling the dashboard takes two days, it is out of date before it is read.
Where the data comes from
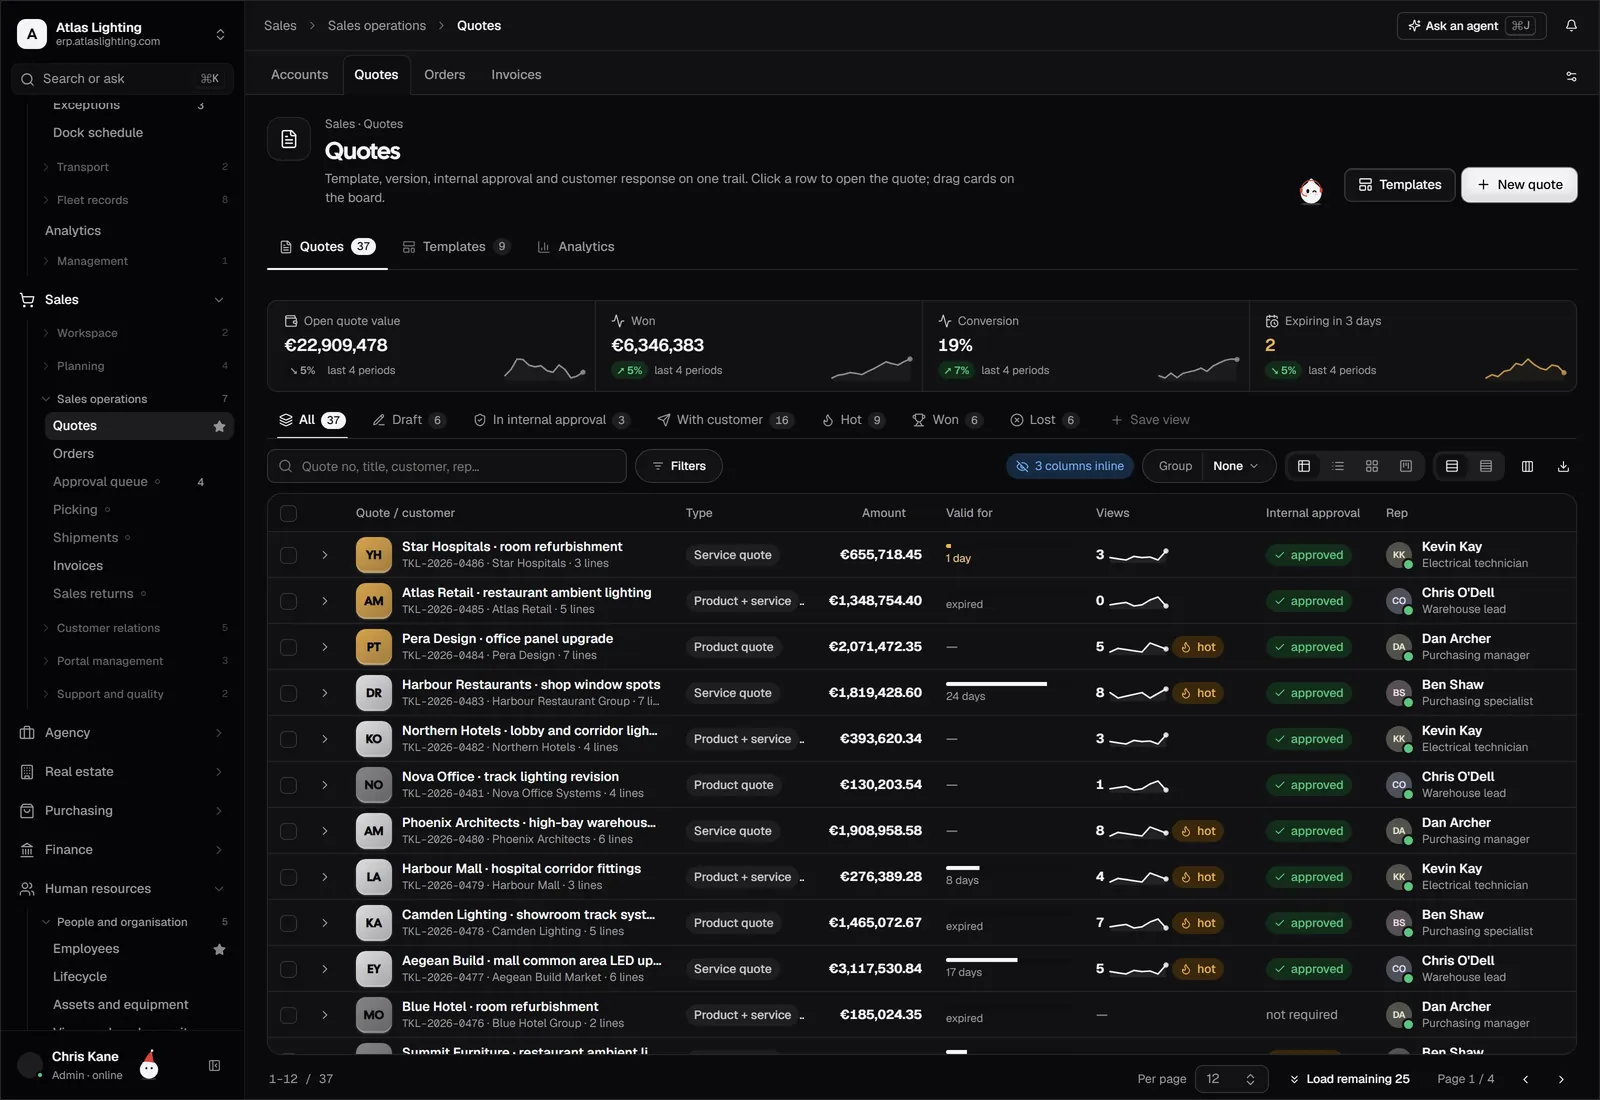
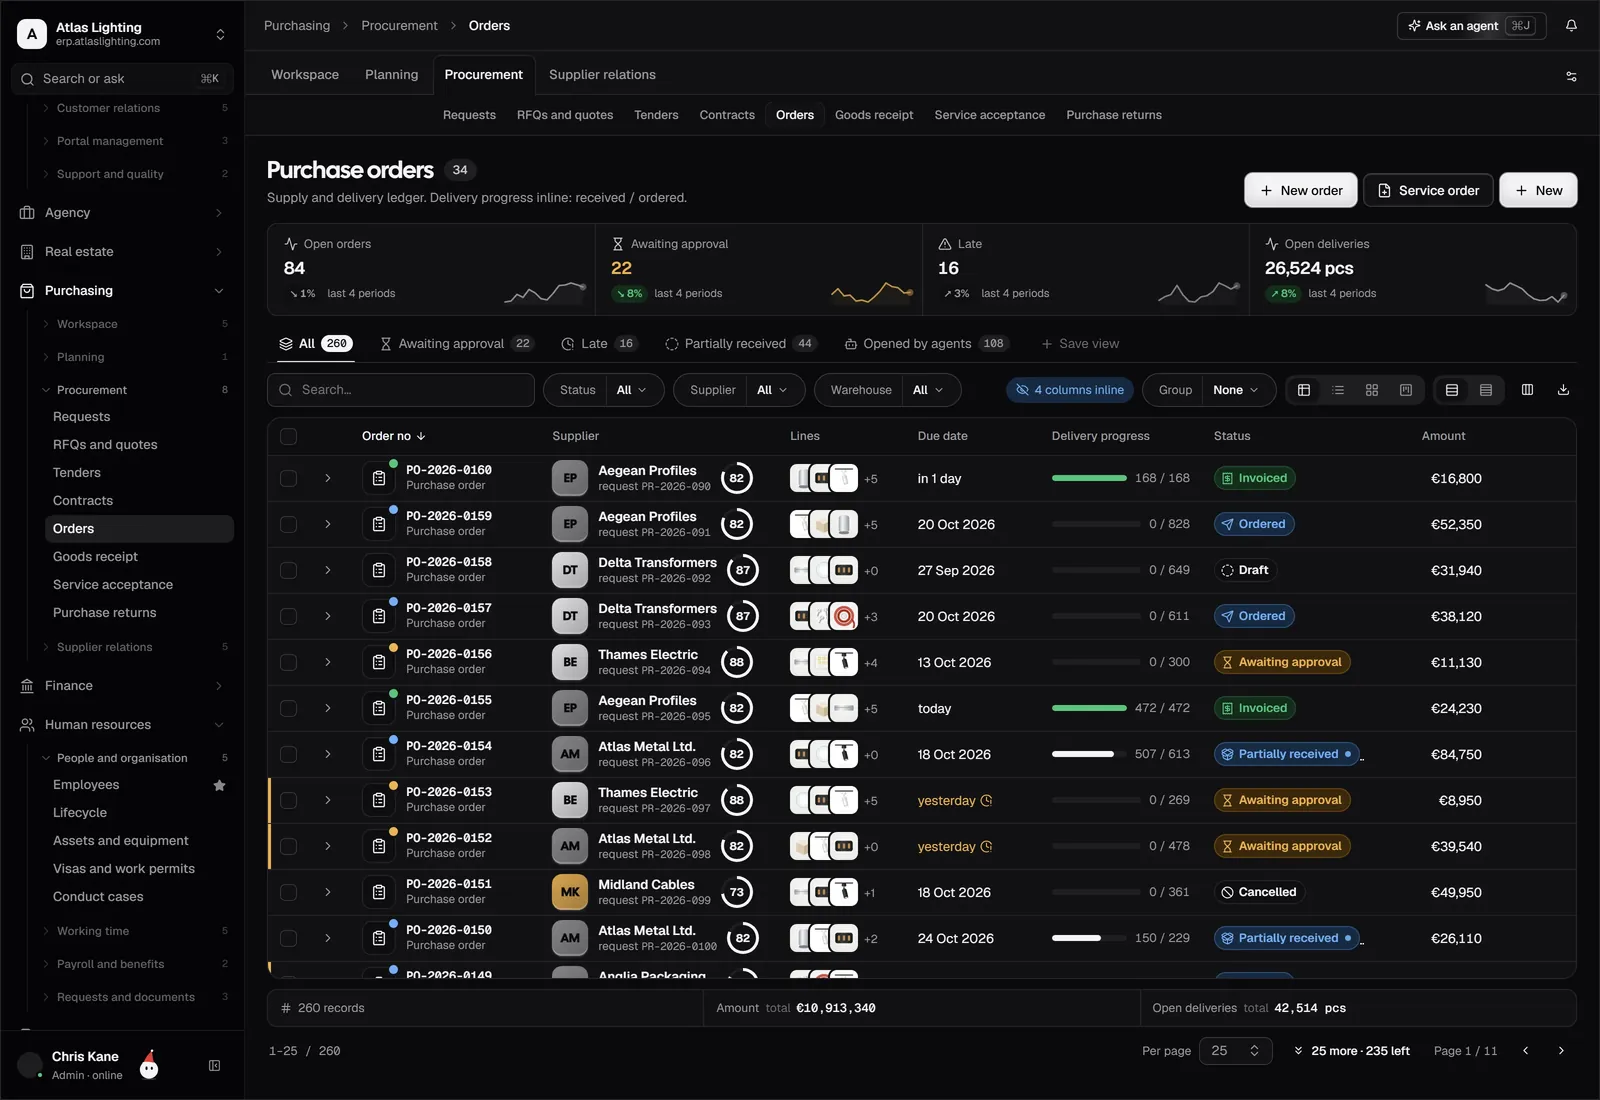
Operational KPIs come from transactions: quotes, orders, receipts, work orders, shipments and invoices. When those live in separate tools, someone has to reconcile them by hand, and that is where errors and delays creep in. When they sit in one system, most KPIs become a saved view: the number updates as the work happens, and you can click from a red figure to the orders behind it.
That is the idea behind reports in an integrated system: every figure traces back to the records that produced it, so a conversation about a KPI becomes a conversation about specific orders. Pair that with accurate inventory data and consistent finance postings and your dashboard stops being a monthly project.
A weekly rhythm that works
Numbers help only if they are reviewed. A light routine is enough:
- Monday, 15 minutes: look at the dashboard together. Only discuss amber and red items.
- Assign actions: each red item gets an owner and a date.
- Monthly: check whether the KPIs still reflect your priorities, and retire any nobody has used.
FAQ
How many KPIs should a small business track?
Between ten and fifteen overall, with three to five per person or team. More than that and nothing gets proper attention.
What is the difference between a KPI and a metric?
A metric is any measurement. A KPI is a metric tied to a business goal, with an owner and a target. All KPIs are metrics, but most metrics are not KPIs.
Which KPIs matter most for cash?
Days sales outstanding, overdue receivables by age, and a rolling cash forecast. Together they show how fast money comes in and whether you can cover what is going out.
Do I need special software to track KPIs?
Not at the start; a spreadsheet works for a few measures. It becomes painful once the data comes from several sources and needs manual updating. That is the point where a connected system pays off.
Make your numbers trustworthy
Dika Ops is an AI-native ERP that keeps sales, stock, purchasing, production and finance in one place, so your KPIs are drawn from the same records your team works in. It is in closed beta, and you can join the waitlist to be invited.